- —{{ i }}


Qualitative B2B client research
Qualitative B2B Research: Why Design Leaders Didn’t Book
A multi-audience website had to sell design training to CX and design leads, while also serving its podcast listeners. I ran moderated testing with leaders who didn't know the brand, and turned 175 tagged observations into a prioritised proposal the client could build.
{{ s.value }}
{{ s.label }}
{{ m.label }}
{{ m.value }}
Multi-user website supporting the user journey
Proof first, then outcomes, then the course detail people kept hunting for.
thisishcd.com/training
THIS IS HCD
For organisationsFor designers
PodcastNewsletterContact
Team trainingLive trainingSelf-paced trainingTrainersFAQ
Design training for high-performing teams
Gerry Scullion, a globally recognised design leader, works with world-class experts in service design, UX and human-centred design to deliver training that is:
EngagingImpactfulImmediately applicable
Book a free exploratory callCheck testimonials
Client testimonial videoCaptions on, so it works without sound
IMPACT
250+
Teams trained
15
Years of experience
40+
Non-profit organisations
30+
Government organisations
Trusted by teams at
CLIENT LOGOCLIENT LOGOCLIENT LOGOCLIENT LOGOCLIENT LOGOCLIENT LOGO
Live training
Cross-industry training
Service Design Fundamentals
BeginnerGerry Scullion
Skill developed: mapping a service end to end
Running Research That Gets Used
IntermediateGuest trainer
Skill developed: planning and synthesising research
Industry-specific
Service Design for Public Services
IntermediateGerry Scullion
Skill developed: designing across departments
Human-Centred Design in Healthcare
BeginnerGuest trainer
Skill developed: co-design with patients and staff
{{ c.what }}
{{ c.why }}
Research
- Current journey Mapped the existing user journey before testing →
- Interviews + observational testing 5 moderated sessions with design and CX leads →
- Hotjar Click heat maps on the home and training pages →
- SEO report Audit of how the site is found and how it performs →
- Interview analysis 175 observations tagged and clustered →
- Combined insights All the data brought together in one journey and a prioritised list
A site built for listeners, sold to buyers
Podcast reach was healthy; training enquiries were not. “Why don't people book?” could have been SEO, positioning, or the page itself — so the plan was built to separate those before any budget was spent.
Two buyers, two very different scans
Both can sign off training. What separates them is how much of a website they're willing to read — and that drove most of the layout decisions.
{{ p.sector }}
{{ p.name }}
{{ p.role }}
{{ p.quote }}
- —{{ b }}
Needs from the page
{{ p.needs }}
175 observations, tagged twice
Each highlight from the recorded sessions got a sentiment tag and a topic tag. The pattern wasn't “they dislike it” — it was “they can't decide”.
By sentiment
{{ s.label }}{{ s.n }}
By topic
{{ s.label }}{{ s.n }}
What they said about the training page
{{ i.kind }}
{{ i.text }}
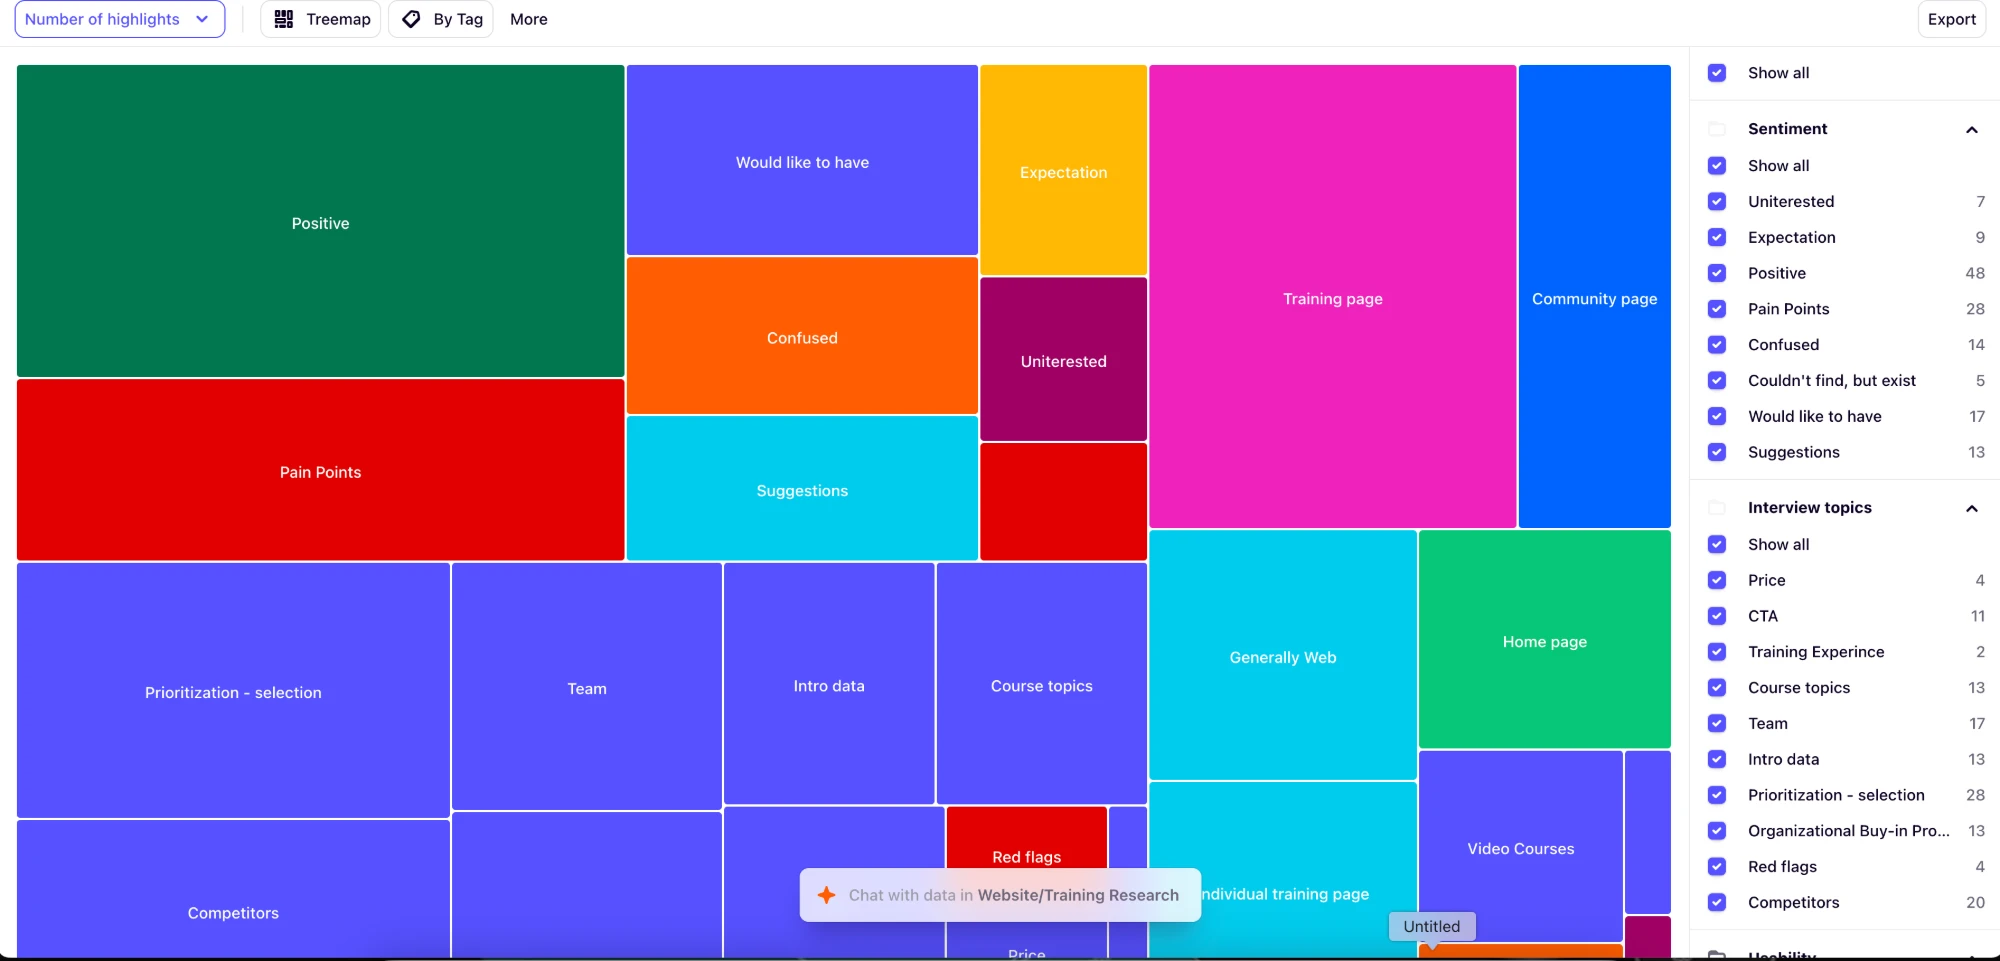
Affinity mapping · problem matrix · 5 observational interviews
Every observation from the five sessions, clustered by affinity into six lenses, colour-coded by participant. Confusions and expectations became the redesign backlog; motivations set its priority.
{{ m.label }}
{{ m.count }}
-
{{ it.text }}
Where people gave up
Recorded, moderated sessions with leaders who didn’t know the brand, backed by heat maps on the training pages. People didn’t just dislike the page — they stopped before reaching the enquiry form.
Click heat maps · Hotjar
Qualitative signal from real visitors, read alongside the sessions: clicks cluster on the nav and the banner close, while the primary CTAs and hero copy stay cold.
{{ d.stage }}
{{ d.text }}
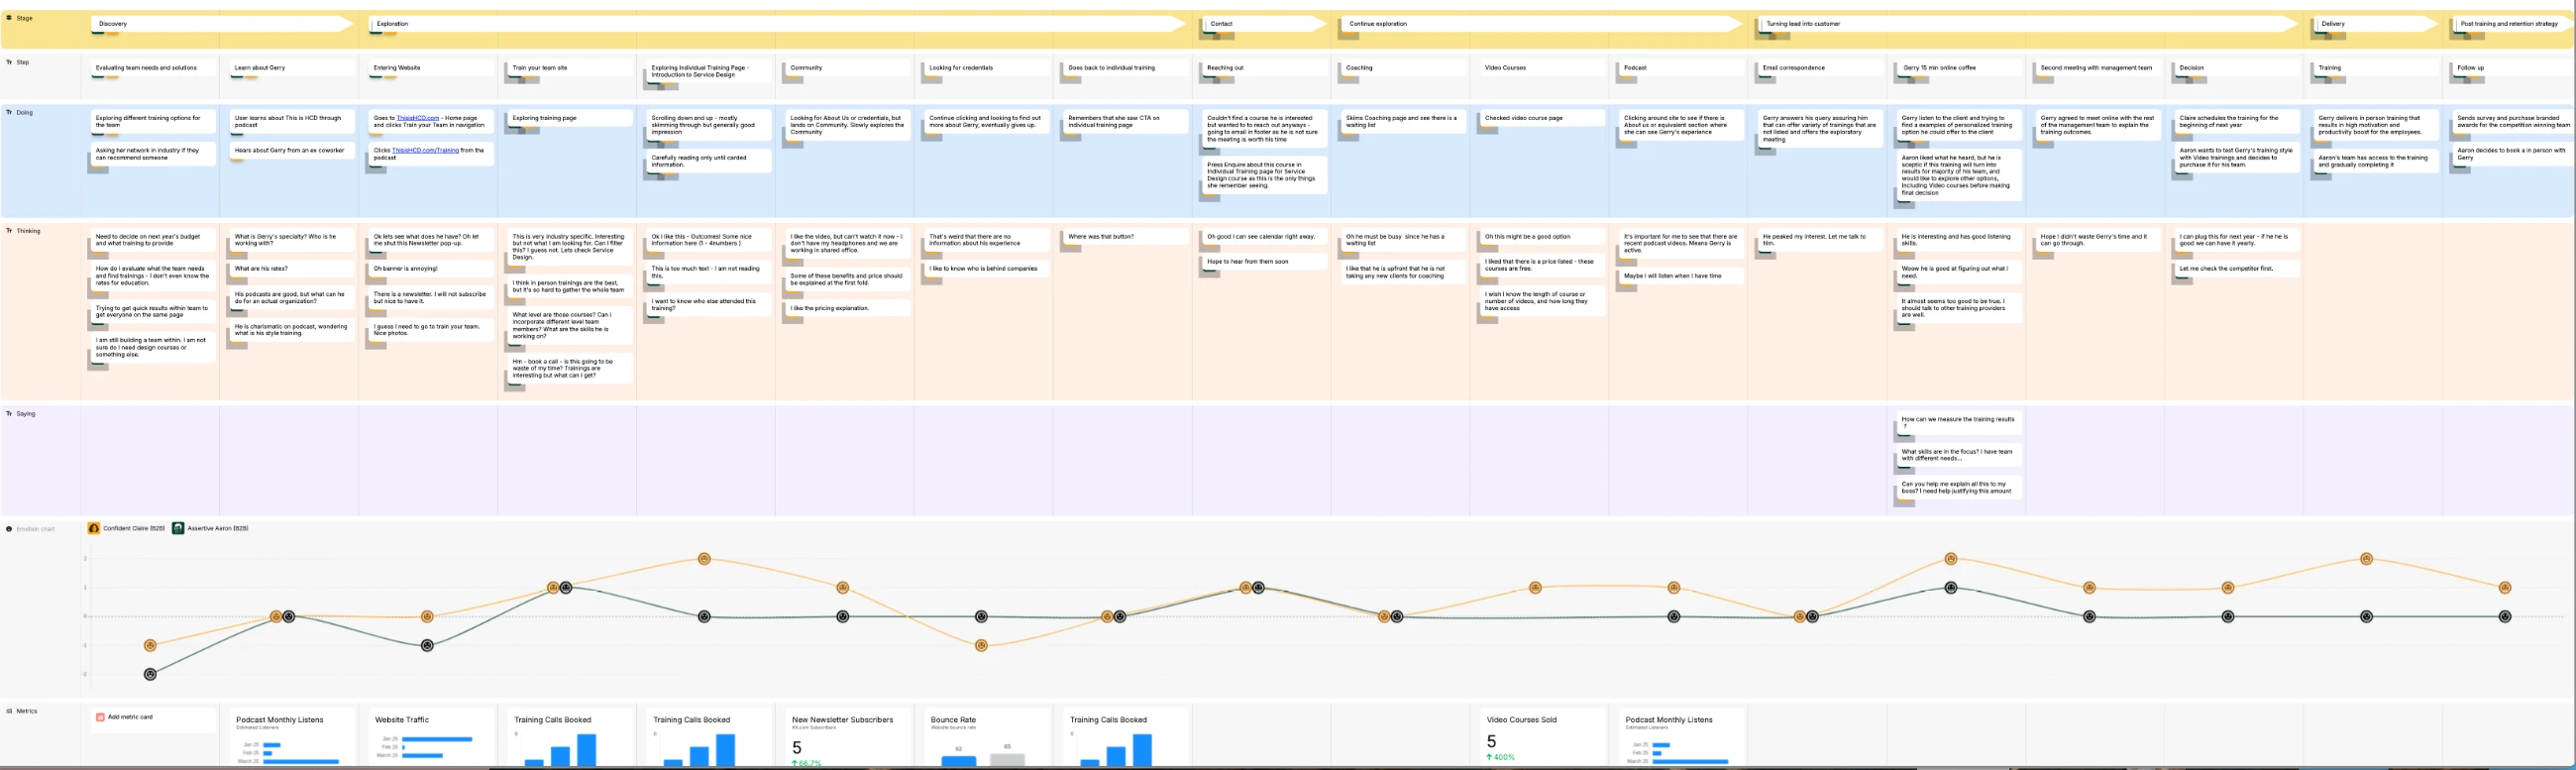
Seven stages, from need to retention
Doing, thinking and saying came straight from session transcripts. Metrics sit under each stage so the client can tie it to a number they already track.
{{ s.n }}
{{ s.label }}
The traffic wasn't the problem
Discoverability was strong. The weak grade was usability — a design problem, not a search one.
{{ g.grade }}
{{ g.label }}
{{ f.label }}
{{ f.text }}
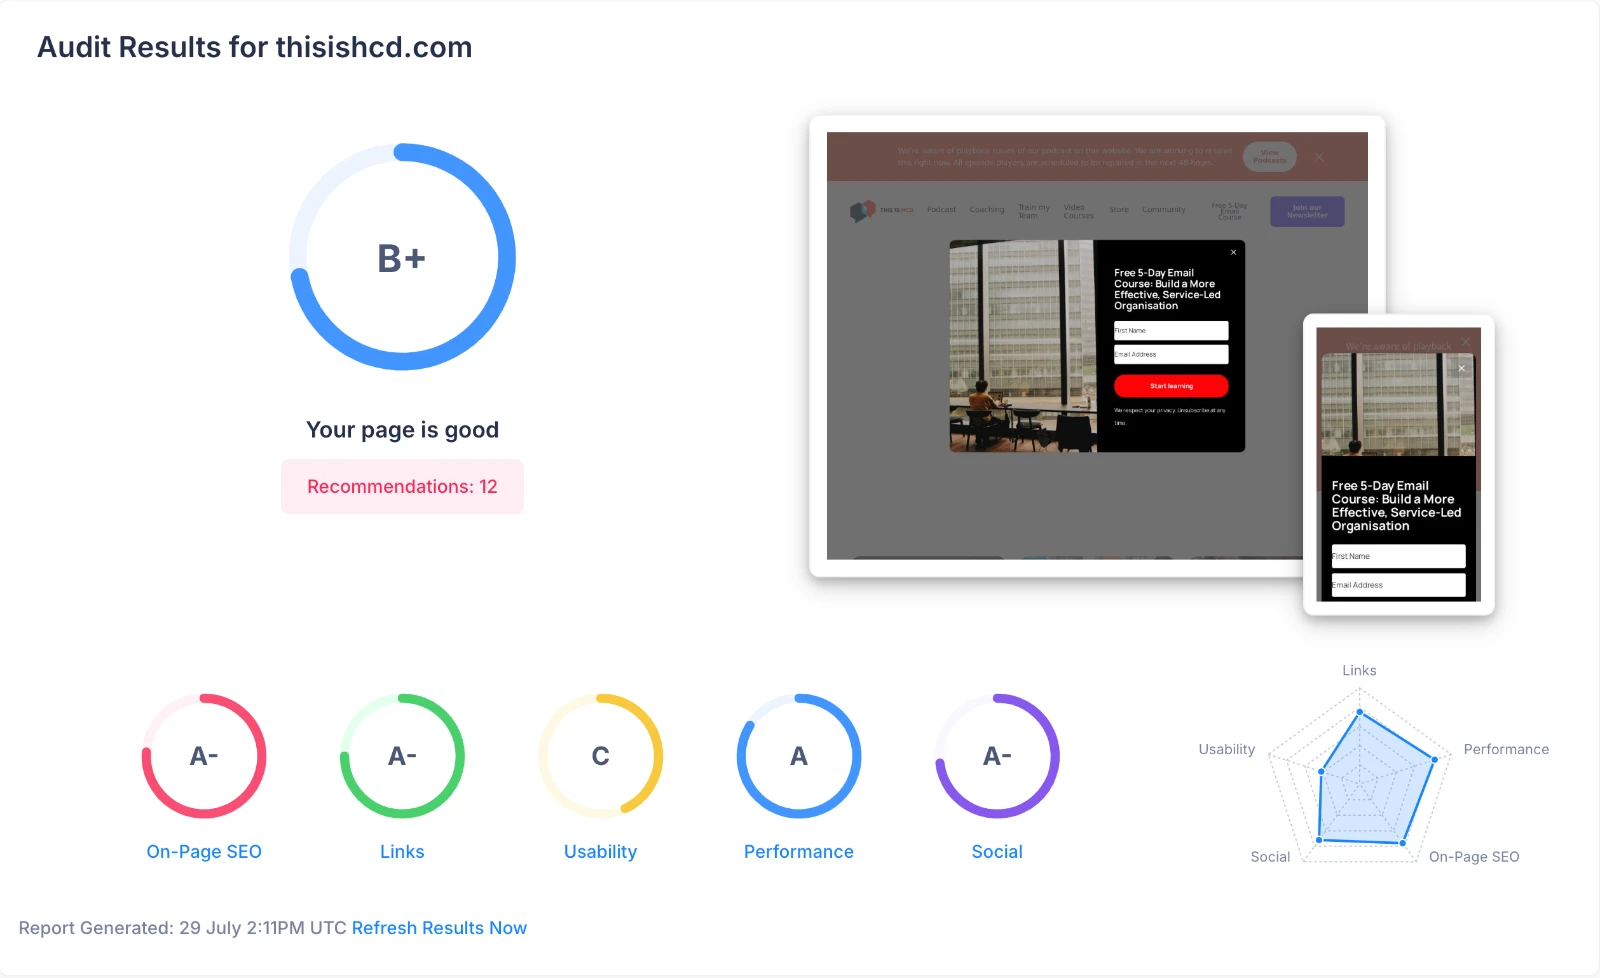
12 audit recommendations
{{ r.text }}
{{ r.cat }}
{{ r.pri }}
Sorted by effect and feasibility
Cheap, high-effect changes ship first; expensive ones become a roadmap instead of a “no”.
{{ q.title }}
{{ q.note }}
{{ n }}